Fast deployment of a containerized SIEM solution (Splunk)
As part of my job, I often have to work with a SIEM solution. SIEM stands for Security Incident and Event Management. It is a set of tools used to retrieve events from logs and/or network frames, and index them for analysis in a security point of view.
Here, we'll talk about log management and SIEM solutions, Splunk, and how to deploy it in a fast and manageable way.
The problem
SIEM solutions are huge, in the sense it takes a lot of work to even get them running properly.
For this kind of programs, this is perfecty normal. These systems are meant to be very reliable. In big organizations, you will probably need powerful hardware (because of a high flow of events), and a whole team to manage it.
But SIEM, and more generaly log management solutions, are cool even if you are not in that category. It enables you to get quick access to any log your machines are producing on a unified interface.
In that way, it would be great to be able to deploy an open source log management solution in a short period of time with minimal configuration.
Besides... it's entertaining.
Choosing a SIEM solution
We won't dive deeply into the choice of a SIEM solution here, but at lest, let's just check licenses. Here is a quick table made for you to compare some SIEM solutions and their licenses.
| Solution | License |
|---|---|
| Elastic Stack | Apache 2.0 |
| Graylog | GNU 3.0 |
| OSSIM | GNU 2.0 |
| IBM QRadar | proprietary |
| Splunk | proprietary |
| LogRhythm | proprietary |
| LogPoint | proprietary |
At first, I wanted to go for an open source solution, but this time I wanted to use a solution I did not know before. Features also differ a lot between those solutions.
I went for Splunk, because I wanted to understand how it worked, and to experiment some of its features to compare with what I'm used to.
Deployment
I'm usually using containers for every services I deploy on personnal equipements. The following deployment is done using Podman containers.
Container
Splunk official image can be found here This is a single container installation.
Persistent storage
With this container, the following directories need to have persistance :
- /etc, for configuration
- /var, for log storage (and much more)
Those will be volumes mounted on our container.
Options
I will use the following options :
- SPLUNK_PASSWORD, to specify a password to the main account, splunk
- SPLUNK_START_ARGS, to accept the lisence using --accept-license
Ports
Of course, the web interface needs to bind to a specific port. In this example, I'm using 8100 (which needs to be mapped to 8000 in the container).
I've also made the choice to send logs to my instance via syslog. For this purpose, I also map a second port (here, 10514).
Launch it
podman run -p 8100:8000/tcp -p 10514:10514/udp -v ./splunk-etc:/opt/splunk/etc/ -v ./splunk-var:/opt/splunk/var/ -e "SPLUNK_START_ARGS=--accept-license" -e "SPLUNK_PASSWORD=YOUR_PASSWORD" --name splunk splunk/splunk:latest
Interface
When Splunk finishes to initialize, you will be able to connect to the interface using a web browser :
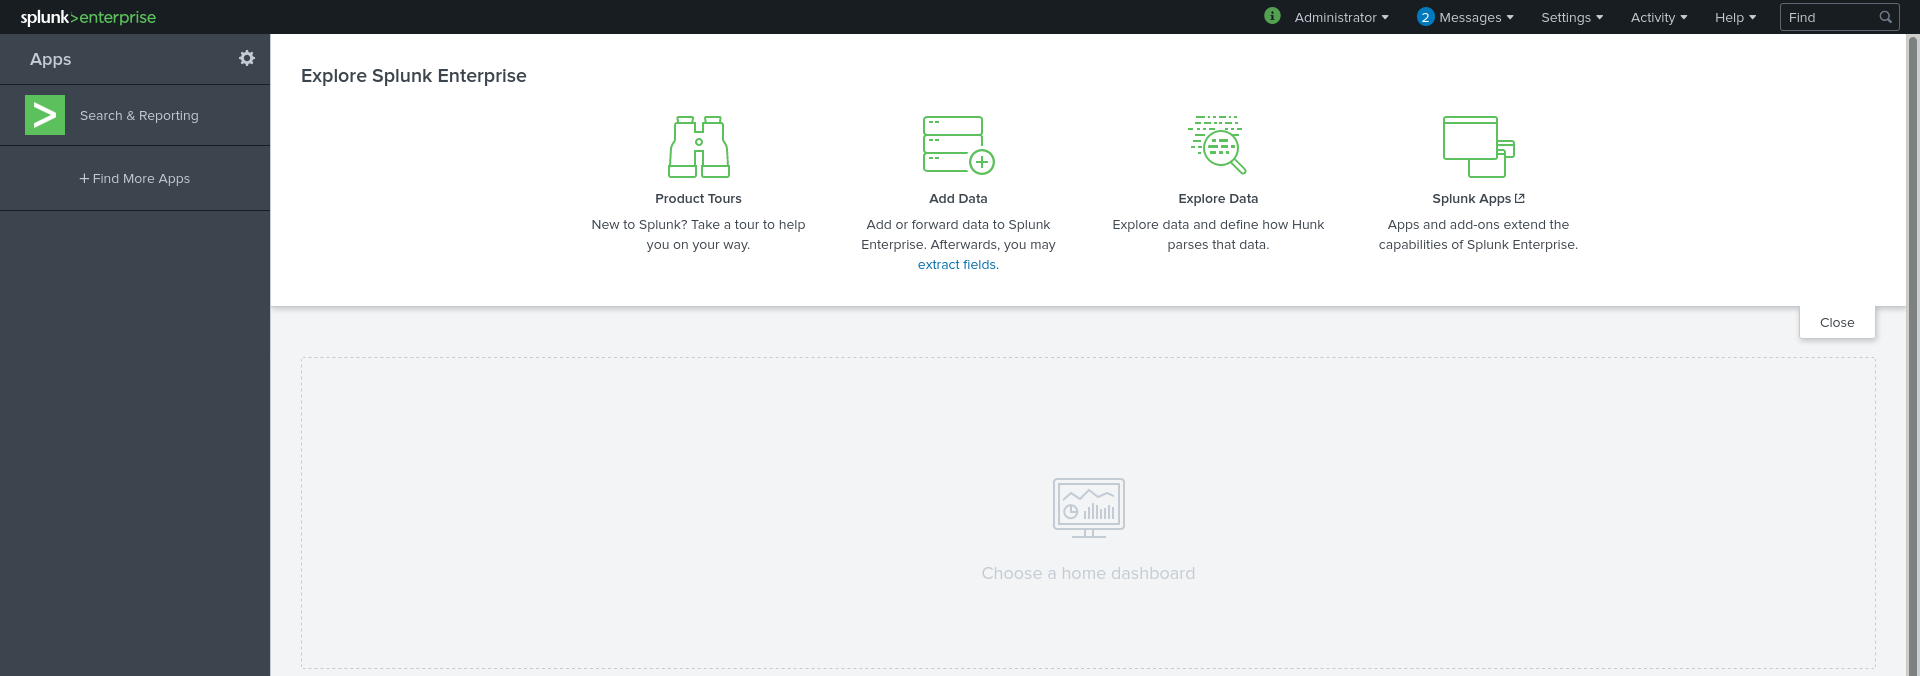
The Search and Reporting app then let you view logs by performing searches.
Log collection
In order to get logs via syslog, you need to setup a new Data input using settings -> Data input -> UDP. Beware : The port must of course be mapped between the container and the host (here, I'am using 10514 but we could use anything else).
Use case
A simple use case is to monitor logs of an Nginx reverse proxy. Let's see how we can do this easily.
Add-on
To do this, a simple solution is to use the official Nginx from Splunk. This app can be found here on Splunk's application store, and the official documentation is located in Splunk's documentation, here.
Nginx Configuration
Having this installed, you will also need to setup the Nginx server, not only to send it via syslog to our Splunk instance, but also to get a good log format, with meaningful information.
For this, I recommand the kv (key-value) format (explained in the documentation).
Here is a sample of nginx.conf to set this configuration :
log_format kv 'site="$server_name" server="$host" dest_port="$server_port" dest_ip="$server_addr" '
        'src="$remote_addr" src_ip="$realip_remote_addr" user="$remote_user" '
        'time_local="$time_local" protocol="$server_protocol" status="$status" '
        'bytes_out="$bytes_sent" bytes_in="$upstream_bytes_received" '
        'http_referer="$http_referer" http_user_agent="$http_user_agent" '
        'nginx_version="$nginx_version" http_x_forwarded_for="$http_x_forwarded_for" '
        'http_x_header="$http_x_header" uri_query="$query_string" uri_path="$uri" '
        'http_method="$request_method" response_time="$upstream_response_time" '
        'cookie="$http_cookie" request_time="$request_time" category="$sent_http_content_type" https="$https"'
Then, to send the logs (here, access logs):
access_log syslog:server=YOURSERVER:10514,facility=local7,tag=nginx,severity=info kv;
Don't forget to adjust parameters as you like, especially the syslog facility.
Searches
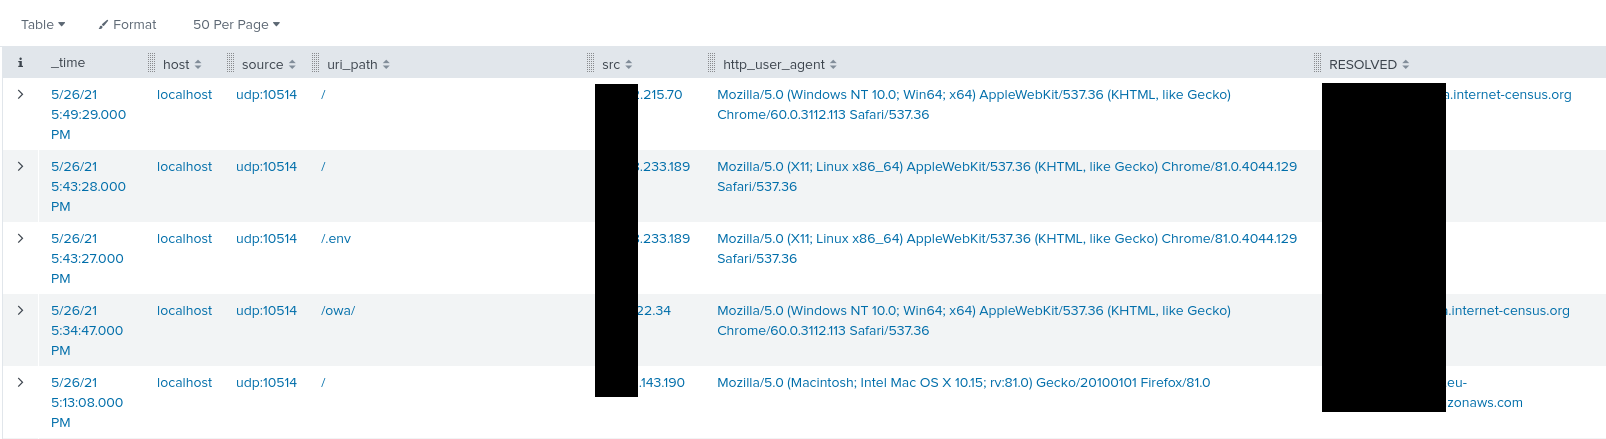
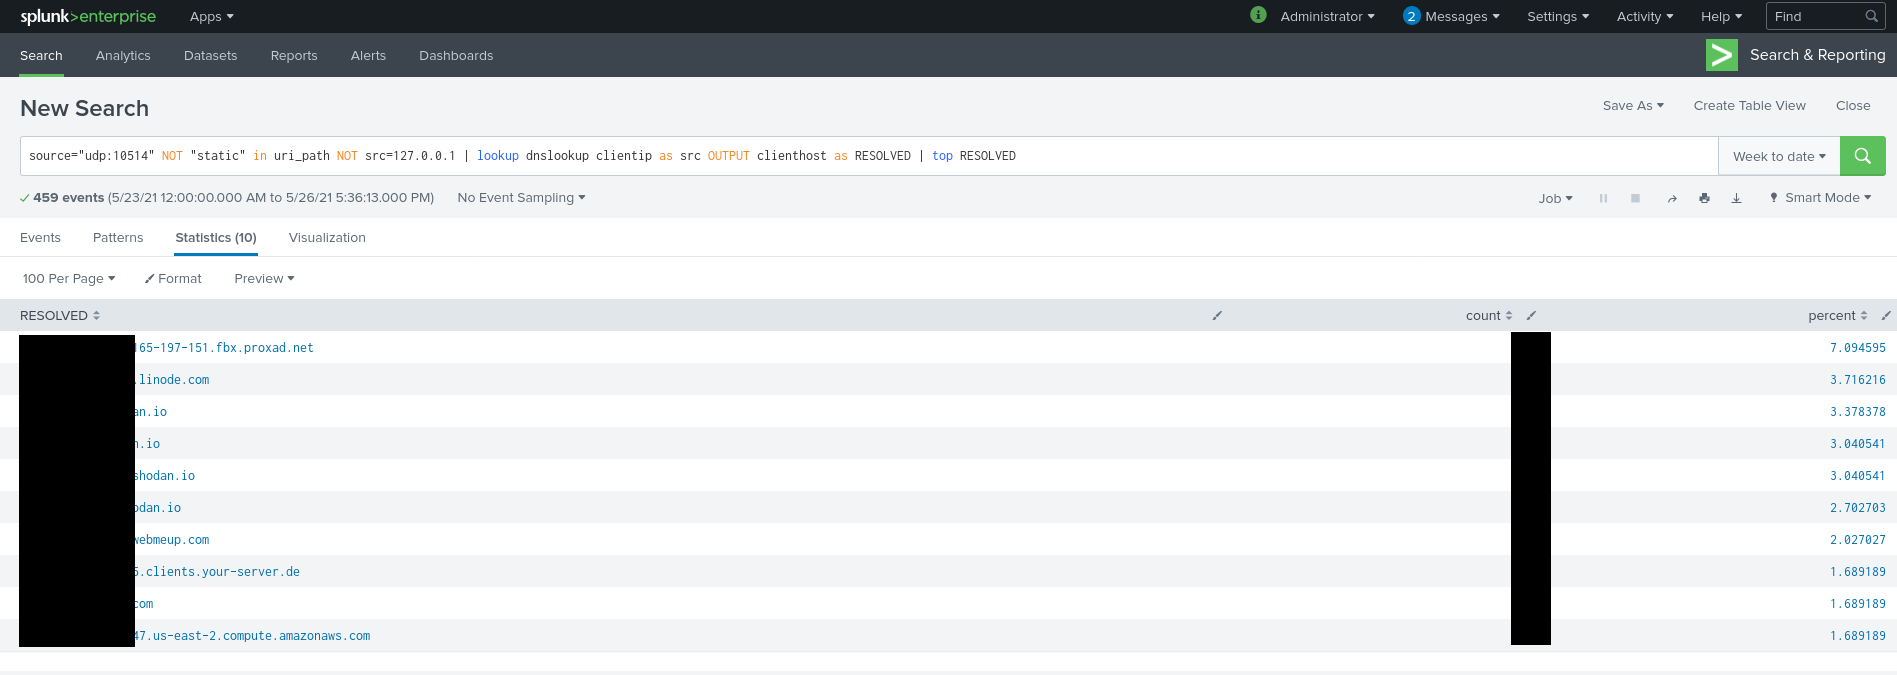
After having configured both the Nginx server for log format and syslog, and our Splunk instance to parse it correctly, we can now search through logs, create dashboards, and much more.
Here are two examples of searches I performed :